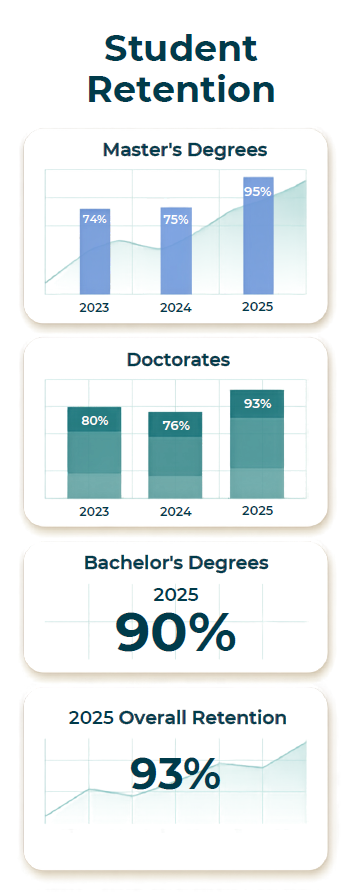
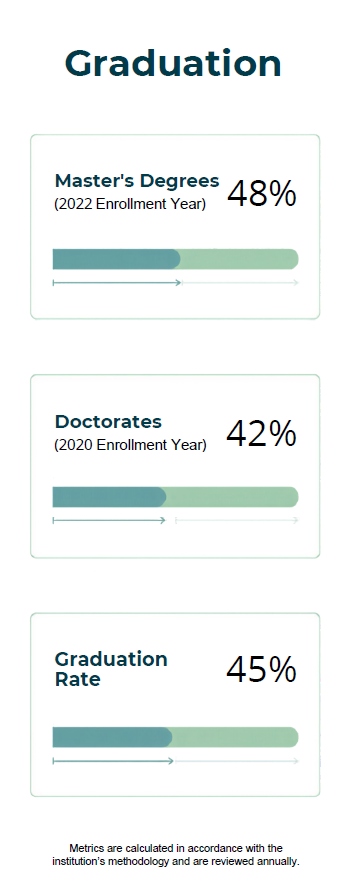
UNIB monitors student achievement through multiple measures that are aligned with its mission and with the profile of the students it serves.
Cohort Outcomes by Entry Year
| Entry Cohort | Total Students | Graduated | Graduation Rate | Active | Active / Persistence Rate | Withdrawn | Attrition Rate |
|---|---|---|---|---|---|---|---|
| 2018 | 1,508 | 824 | 54.64% | 322 | 21.35% | 362 | 24.01% |
| 2019 | 2,181 | 1,260 | 57.77% | 451 | 20.68% | 470 | 21.55% |
| 2020 | 1,813 | 1,134 | 62.55% | 168 | 9.27% | 511 | 28.19% |
| 2021 | 1,527 | 884 | 57.89% | 183 | 11.98% | 460 | 30.12% |
| 2022 | 1,036 | 474 | 46.24% | 257 | 24.81% | 300 | 28.96% |
| 2023 | 765 | 479 | 32.81% | 357 | 46.67% | 157 | 20.52% |
| 2024 | 783 | 251 | 7.79% | 561 | 71.65% | 161 | 20.56% |
| 2025 | 613 | 161 | 0.00% | 572 | 93.31% | 141 | 6.69% |
Key Indicators and Institutional Goals
| Student Achievement Indicator | Institutional Benchmark | Most Recent Outcome |
|---|---|---|
| Student Retention | ≥ 75% | Approximately 80%+ |
| Graduation Rate (Mature Cohorts) | ≥ 55% | 54–62% |
| Student Persistence | ≥ 10% | Benchmark Achieved |
| Student Attrition | ≤ 30% | 20–30% by Cohort |
Use of Results for Improvement
Student achievement indicators are reviewed annually by academic leadership and program coordinators as part of the institutional effectiveness cycle. Retention, dropout, and graduation data are used to:
- Identify programs or cohorts requiring additional academic or student support.
- Inform decisions about curriculum pacing, course load recommendations, and learning resources.
- Guide the design of interventions such as tutoring, mentoring, and early-alert systems for at-risk students.
- Evaluate the impact of prior interventions on persistence and completion.
Documented analyses of trends in retention, persistence, dropout, and graduation are shared with relevant committees and academic units, and action plans are developed where indicators fall below the established thresholds or do not progress towards the stated targets.
